


Trusted by these customers


- Asset Loss & Replacement Costs ↓ 30–80%
- Workforce Productivity ↑ 15–40%
- Operational Downtime ↓ 20–50%
- Asset Utilisation ↑ 10–30%
Common Persona Challenges
Top Facilities Manager Pain Points Smart Lockers Manage
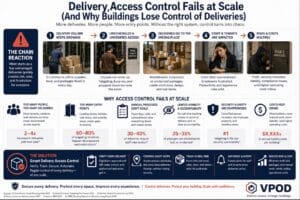
Why Delivery Access Fails at Scale
1. Buildings Were Not Designed for Modern Delivery Volumes
2. Too Many Couriers Arrive at the Same Time
3. Manual Delivery Check-In Creates Bottlenecks
4. Reception Becomes the Delivery Processing Centre
5. Security Procedures Slow Delivery Throughput
6. Lack of Dedicated Delivery Access Routes
7. Parcel Storage Capacity Is Quickly Exhausted
8. No Real-Time Visibility of Deliveries
9. Delivery Operations Depend Too Heavily on Staff
10. Multiple Delivery Providers Create Operational Complexity
11. Failed Deliveries Generate Repeat Visits and Congestion
12. Collection Processes Create Additional Queues
13. Peak Demand Exposes Process Weaknesses
14. Delivery Access Becomes an Occupier Experience Problem
15. Delivery Infrastructure Cannot Scale With Demand

Delivery Staffing Costs Spiral at Scale – Headline Options
1. Rising Delivery Volumes Outpace Staffing Capacity
2. Manual Parcel Processing Consumes Valuable Staff Time
3. Recipient Notifications Create Hidden Labour Costs
4. Parcel Handling Requires Multiple Touchpoints
5. Parcel Room Management Becomes a Full-Time Operation
6. Repeat Handling Drives Operational Inefficiency
7. Failed Collections Increase Labour Dependency
8. Peak Delivery Periods Require Additional Staffing
9. Reception Teams Become Delivery Administrators
10. Delivery Exceptions Consume Disproportionate Resources
11. Manual Tracking Creates Administrative Overhead
12. Storage Management Becomes Increasingly Complex
13. Courier Waiting Times Create Additional Workload
14. Delivery Operations Expand Faster Than Budgets
15. Labour Costs Rise While Efficiency Falls

10 Reasons Why Parcel Rooms Overflow at Scale
1. Delivery Volumes Grow Faster Than Storage Capacity
2. Buildings Were Not Designed for Modern Parcel Demand
3. Too Many Deliveries Arrive During Peak Periods
4. Residents and Employees Delay Collections
5. Manual Notification Processes Slow Collections
6. Failed Collection Attempts Cause Parcel Backlogs
7. Oversized Deliveries Consume Disproportionate Space
8. Lack of Real-Time Parcel Visibility Creates Congestion
9. Staff-Dependent Collection Processes Restrict Throughput
10. Parcel Rooms Have No Mechanism to Scale with Demand
10 Reasons Why Manual Asset Logging Breaks at Scale
1. Human Error Increases as Asset Volumes Grow
2. Asset Records Quickly Become Outdated
3. Manual Processes Create Inconsistent Data
4. Staff Forget to Log Asset Movements
5. Shared Assets Create Accountability Gaps
6. Asset Audits Become Time-Consuming and Expensive
7. Missing Assets Cannot Be Traced Quickly
8. Multiple Locations Create Visibility Blind Spots
9. Manual Logging Creates Administrative Overhead
10. The Process Cannot Scale With Operational Growth
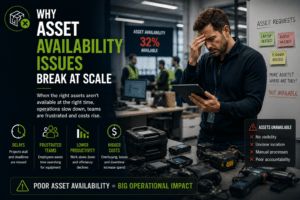
Why Asset Storage Creates Facilities Friction
Facilities managers face challenges when:
- Equipment is left in corridors or shared areas
- Storage rooms become disorganised
- Responsibility for assets is unclear
- Manual tracking is inconsistent
Over time, unmanaged equipment storage creates safety and maintenance pressure.


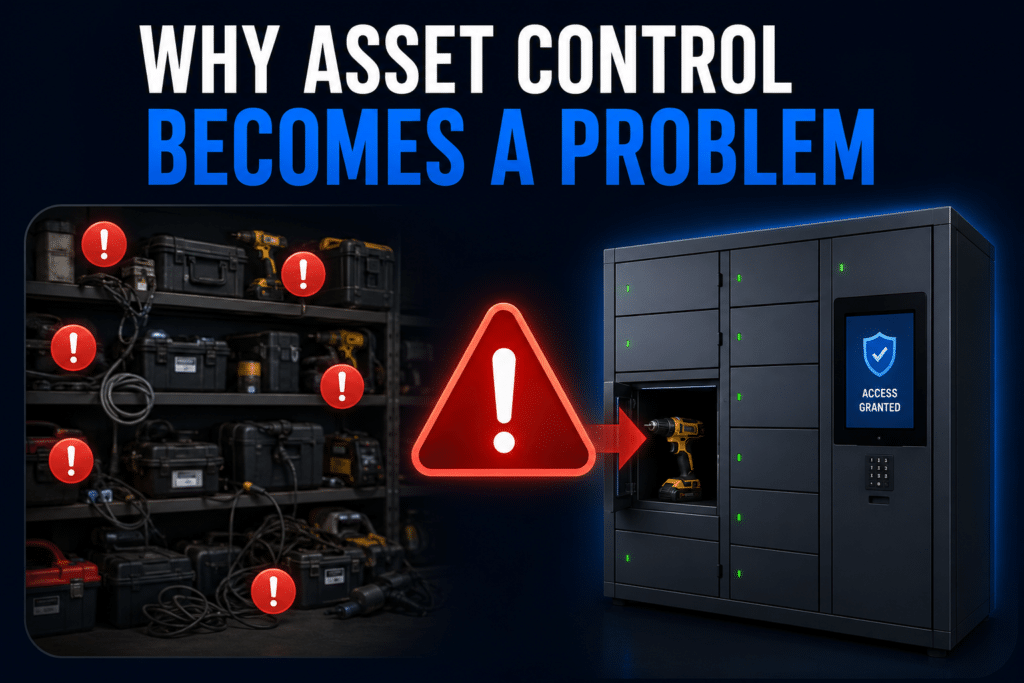
How Asset Lockers for Facilities Managers Improve Control
Equipment is stored in defined, secure locations
Access is restricted to authorised users
Issue and return activity is logged automatically
Shared spaces remain clear and organised
Asset Locker Efficiency Gains
| Operational Area | Typical Improvement |
|---|---|
| Asset Loss & Shrinkage | ↓ 30–95% |
| Asset Retrieval Time | ↓ 50–90% |
| Equipment Availability | ↑ 20–60% |
| Workforce Productivity | ↑ 15–40% |
| Administrative Workload | ↓ 50–90% |
| Manual Logging Activity | ↓ 70–100% |
| Audit Preparation Time | ↓ 50–95% |
| Operational Downtime | ↓ 20–50% |
| Asset Utilisation | ↑ 10–30% |
| Equipment Checkout Time | ↓ 60–95% |
| Chain of Custody Visibility | ↑ Up to 100% |
| Compliance Reporting Effort | ↓ 50–90% |
| Asset Replacement Costs | ↓ 20–80% |
| Inventory Accuracy | ↑ 90–100% |
| Staff Waiting Time for Equipment | ↓ 50–95% |
| Accountability for Shared Assets | ↑ Up to 100% |
| Security Incidents | ↓ 30–80% |
| Multi-Site Asset Visibility | ↑ Up to 100% |
| Asset Search Time | ↓ 70–95% |
| Equipment Turnaround Time |
Asset Locker Efficiency Gains
These are the most commonly achieved operational and financial improvements from asset locker deployments.
| ROI Area | Typical Improvement |
|---|---|
| Asset Loss & Shrinkage | ↓ 30–95% |
| Asset Replacement Costs | ↓ 20–80% |
| Time Spent Searching for Assets | ↓ 70–95% |
| Equipment Checkout Time | ↓ 60–95% |
| Administrative Workload | ↓ 50–90% |
| Manual Logging & Record Keeping | ↓ 70–100% |
| Audit Preparation Time | ↓ 50–95% |
| Operational Downtime | ↓ 20–50% |
| Workforce Productivity | ↑ 15–40% |
| Asset Utilisation | ↑ 10–30% |
| Equipment Availability | ↑ 20–60% |
| Inventory Accuracy | ↑ 90–100% |
| Asset Accountability | ↑ Up to 100% |
| Compliance Visibility | ↑ Up to 100% |
| Shared Asset Availability | ↑ 20–50% |
| Labour Required for Asset Management | ↓ 30–70% |
Locker Systems as Part of Operational Strategy
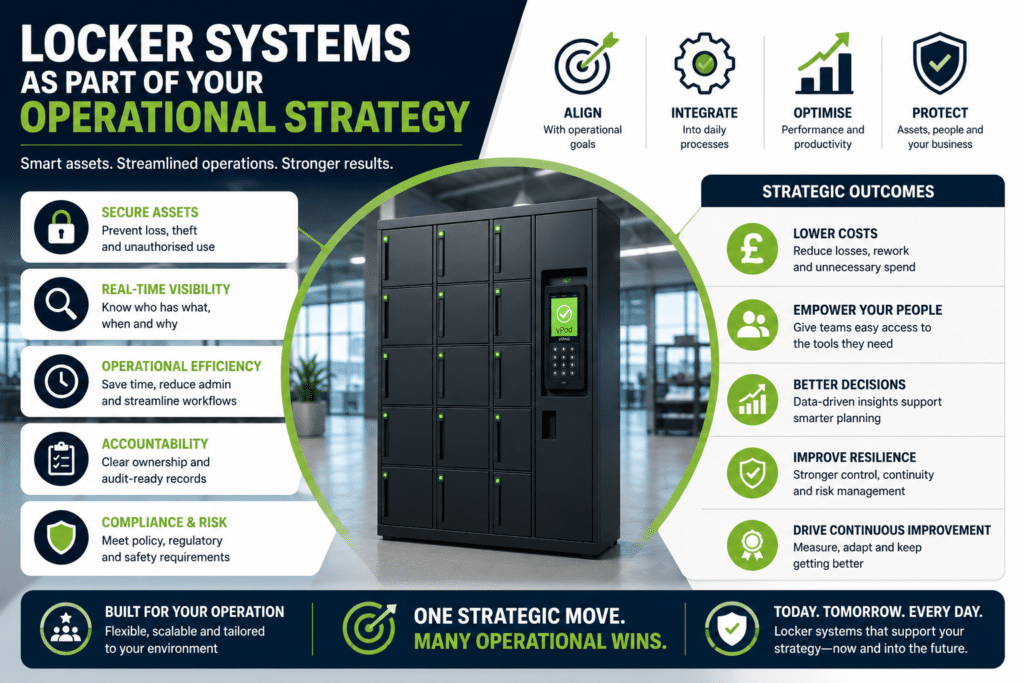
- Reduced Operational Workload
- Improved Asset Visibility
- Lower Asset Loss and Replacement Costs
- Higher Workforce Productivity
- Reduced Operational Downtime
- Stronger Asset Accountability
- Improved Compliance and Audit Readiness
- Cleaner Shared Spaces
- More Predictable Daily Site Management
- Better Use of Existing Assets
- Reduced Administrative Burden
- Faster Asset Issue and Return
- Improved Workplace Safety
- Enhanced Security and Access Control
- Increased Asset Utilisation
- Real-Time Operational Visibility
- Reduced Reactive Workload
- Streamlined Facilities Operations
- Improved Multi-Site Asset Management
- Greater Control Over Shared Resources
- Faster Incident Investigation
- Reduced Equipment Search Time
- Better Resource Planning
- Improved Service Delivery
- Stronger Operational Resilience
- Reduced Risk and Liability
- Improved Space Utilisation
- Data-Driven Facilities Management
- Lower Total Cost of Ownership
- Scalable Facilities Operations
- Consistent Operational Standards Across Sites
- Increased Self-Service Access
- Reduced Equipment Downtime
- Improved Workforce Experience
- Operational Efficiency at Scale
- Stronger Business Continuity
- Measurable Facilities Performance
- Better Contractor and Visitor Asset Control
- Continuous Operational Improvement
- Greater Facilities Management ROI
Asset Smart Lockers vs Manual Asset Storage
Asset Smart Lockers
Real-time visibility of who has what
Full user audit trail
Seconds
Low
Controlled access reduces misuse
Manual Asset Storage
Limited or no visibility
Relies on manual records
Minutes to hours
High
Difficult to monitor
Structured Equipment Storage Across Sites & Shifts
In environments where tools, devices, or shared assets move between teams and shifts, manual systems quickly break down. Informal storage increases clutter and reactive problem-solving. Asset lockers introduce a repeatable issue-and-return workflow that can be deployed across departments or sites. Access permissions and usage rules can be configured centrally while maintaining flexibility for local teams. This transforms asset storage from informal handling into controlled infrastructure aligned with facilities planning.
Pain Points Summary
PP1
why asset audit trails break at scale and why manual tracking-fails
Find out more →
PP2
workplace lockers pain points manual asset logging breaks
Find out more →
PP3
workplace lockers pain points manual asset logging breaks
Find out more →
Outcomes Facilities Managers Care About
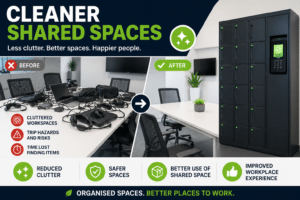
Cleaner shared spaces
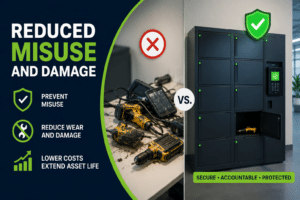
Reduced misuse and damage
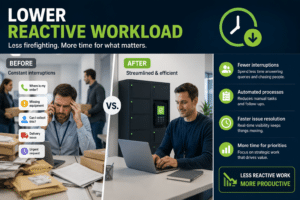
Lower reactive workload
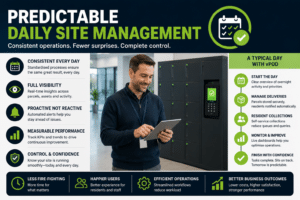
More predictable daily site management
Supporting Safety & Site Governance
Every asset issue and return is recorded automatically, creating a clear audit trail of equipment access and activity. Time-bound access prevents long-term occupation and misuse. By replacing informal storage with structured compartments, facilities teams reduce clutter, improve safety compliance, and maintain organised environments under continuous use. Asset lockers become part of the physical management layer — not an unmanaged storage area.

See How Asset Lockers Work in Practice
Explore Facilities Challenges
-
Reduce equipment misuse
-
Improve shared space organisation
-
Lower facilities workload
-
Improve asset accountability